[Day 119] Graph Convolutional Transformer application on electronic health records
Hello :)
Today is Day 119!
A quick summary of today:
- read Learning the Graphical Structure of Electronic Health Records with Graph Convolutional Transformer by Choi et al. (2020)
- saw: Four Ways of Thinking: Statistical, Interactive, Chaotic and Complex - David Sumpter (youtube)
I learned about Graph Transformers on Day 110 and I had saved this paper from Professor Choi and wanted to read it for a while.
Firstly, I wrote some summary notes of it.
One, it involves the usage of graphs, and two - Professor Edward Choi wrote it (I studied some of his lectures on intro to AI)
Studying electronic healthcare records (EHR) using deep learning can help in various tasks, including predicting diagnosis, learning medical ceoncept representations, and making interpretable predictions. EHR data is often store as hierarchical graphs as in the picture.
The common way to to process this data is to consider each encounter as an unordered set of features which does not care about its graphical structure. In the real-world there is incomplete information (some of the red links are missing). In addition to viewing EHR data as a graph, the paper proposes the use of the infamous Transfomer to explicitly learn the EHR structure, and also perform supervised prediction tasks - called the Graph Convolutional Transformer.
Assuming links(edges) are missing, we do not have an explicit adjecency matrix A. So what they do in that case is the tell self-attention that all the nodes are fully-connected, and it will learn which connections are stronger than others.
To help the transformer not to go around looking at all potential edges, based on: (1) data stats (i.e. treatment nodes can only be connected to diagnosis nodes); and (2) conditional probs from the data (i.e. p(EKG|chest pain) is usually larger than p(EKG|fever)) - they restrict the space where the search can look at.
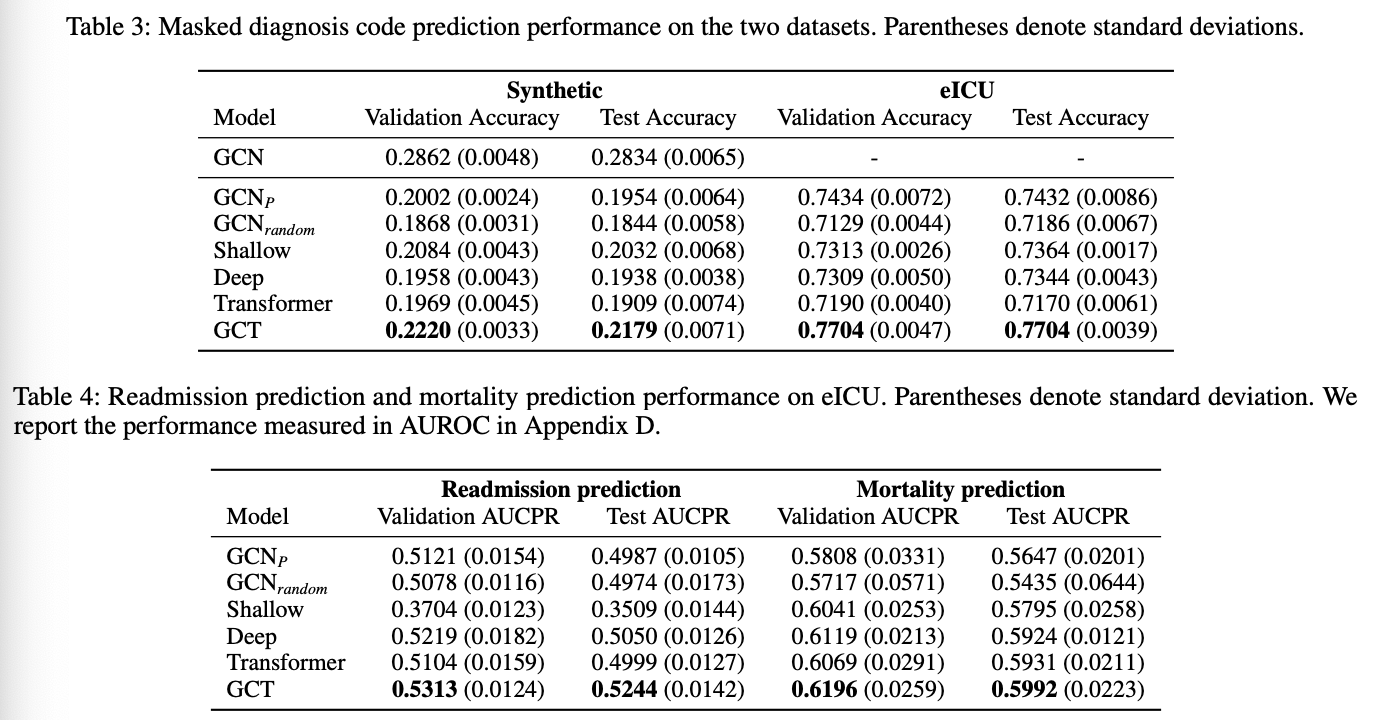
They use synthetically created data and real data (eICU Collaborative Research Dataset) for evaluation on 5 methods alongside the proposed GCT (Graph Conv. Transformer).
Results are:
Having studied graphs for the past month or so definitely helped reading this paper ^^
Secondly, I took some pics/notes of the lecture on 4 ways of thinking
1. Statistical thinking
We can always try to quantify something - an attitude, a change in attitude, feeling, testing whether we can taste the difference between coke and pepsi. But we don't really need to quantify everything. In addition, sometimes the data can be biased, and for example, even though students from top universities may succeed in life, there are high school dropouts that do as well. Context is important, if we quantify a player's performance measure, that does not mean that the overall game for their team improves. And finally, we need to be careful with causation vs correlation when creating models.
2. Interactive thinking
Interactive thinking is to engage with information/ideas through dialogue or exploration in order to gain deeper understanding and generate new insights.
The presenter showed these equations:
3. Chaotic thinkging
Here, the presenter talked about how 2 points can start together and even though we introduce small movement to each, after a little while they will end up on totally different paths.
4. Complex thinking
The above is a very high-level overview of the talk, in the talk I was presented with specific examples and how we can better understand each type of thinking, so it is definitely worth the watch.
That is all for today!
See you tomorrow :)


